
Northstar | Aligning planning and better visibility with stronger outcomes
District planning was fragmented across spreadsheets, email threads, and disconnected dashboards -leaving leaders unable to see execution, and schools duplicating work with no shared source of truth.
Role
Lead UX Designer & Researcher
Timeline
12 weeks - Five-phase research & design engagement · 2024
Team
2 Designers
2 Researchers
1 Product Lead
1 Program Sponsor
1 Executive Sponsor
Primary metric
78% ↑ planning efficiency
$1.2M annualized savings

OVERVIEW
The snapshot
Challenge
About 40 schools across the district planned independently, with only 42% cross-school visibility, 74% of planning work happening outside any shared system, and reporting alone consuming 18 hours per administrator every week.
Approach
Led a 12-week, five-phase research engagement covering discovery, analysis, synthesis, validation, alignment, and planning. Worked with 96 participants across district leadership, principals, curriculum teams, and teachers.
Conducted 56 interviews, 5 workshops, and reviewed 120+ planning documents to map the full district planning lifecycle.
Result
Connected goal-setting, curriculum alignment, execution, reporting, and intervention in one platform. Improved planning efficiency from 46% to 82% and cut weekly reporting effort from 18 hours to six.
HERO METRIC
78%
Improvement in planning efficiency
PROBLEM
What was breaking
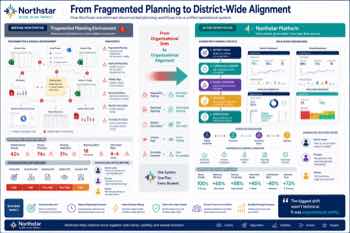
Manual, disconnected processes consumed 74% of planning work, with administrators spending up to 18 hours a week collecting and reconciling reports
Cross-school visibility sat at just 42%, leaving district leaders unable to see execution until problems had already taken hold
Struggling schools waited 4-6 weeks between an issue emerging and support arriving, since intervention depended on manual, after-the-fact reporting
This wasn't a reporting problem. It was an alignment problem.
DISCOVERY
How I learned it
Discover - stakeholder interviews & current-state mapping
Analyze - workflow, governance & information-flow mapping
Synthesize - insight generation & opportunity mapping
Validate - findings review & prioritization with district leaders
Planning happens in silos, with every school inventing its own format
Found in 56 stakeholder interviews across 4 districts
Ownership is ambiguous - no one is clearly accountable for closing the loop
Found in governance mapping & workshop synthesis
Reporting consumes hours but delivers limited strategic value
Found in document analysis & stakeholder survey
INSIGHTS
The moments things clicked
Fragmented planning is the root cause, not the symptom
Schools build plans independently, in inconsistent formats and disconnected tools, so nothing rolls up into a shared district picture.
Leaders can't see execution until it's already a problem
With only 42% cross-school visibility, district leaders learn about at-risk schools weeks after issues emerge, not while there's still time to act.
Hospitals lack real-time visibility and control
Administrators spend up to 18 hours a week compiling updates by hand, time pulled directly from instructional leadership and support.
STRATEGY
How I chose what to build
A compliance workflow so confusing, 1 in 3 users abandoned it mid-form.
A compliance workflow so confusing, 1 in 3 users abandoned it mid-form.
A compliance workflow so confusing, 1 in 3 users abandoned it mid-form.
A compliance workflow so confusing, 1 in 3 users abandoned it mid-form.
A compliance workflow so confusing, 1 in 3 users abandoned it mid-form.
A compliance workflow so confusing, 1 in 3 users abandoned it mid-form.
THE TRADE OFF
A compliance workflow so confusing, 1 in 3 users abandoned it mid-form.
SOLUTION
The final shape of things
1
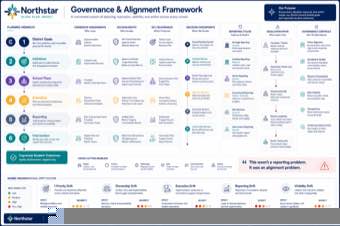
Six stages, one governed lifecycle
District goals flow into initiatives, school plans, execution, reporting, and intervention through defined ownership, decision rights, and approval gates at every stage - so nothing moves forward without clear accountability.
2
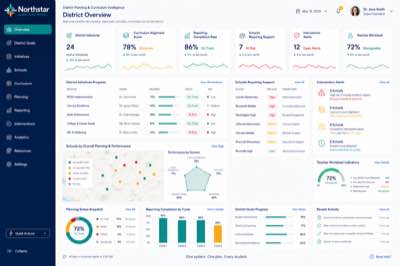
Real-time visibility replaces after-the-fact reporting
District and school dashboards surface initiative progress, curriculum alignment, and at-risk schools as they happen, turning weeks-old status updates into a live, shared picture.
3
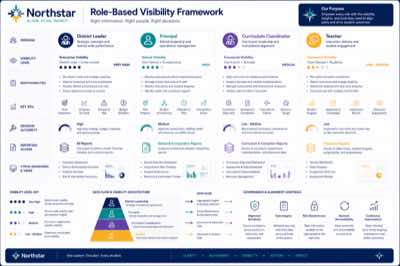
Every role sees exactly what it needs
District leaders get enterprise-wide visibility, principals see their school in context, curriculum coordinators see alignment data, and teachers see their classrooms - each with the KPIs and decision authority appropriate to their role.
IMPACT
What actually shifted

78%
Planning efficiency (46% to 82%)

66%
Weekly reporting time (18 to 6 hrs)
138%
Cross-school visibility (42% to 100%)

67%
Intervention speed (4-6 wks to 1-2 wks)
BEFORE
46% planning efficiency
18 hrs/week spent on reporting
42% cross-school visibility
AFTER
82% planning efficiency
6 hrs/week spent on reporting
100% cross-school visibility
As a principal, what I value most about NorthStar is that it gives us a common language. When priorities compete or teams disagree, we can come back to the framework and have a much more productive conversation. It’s helped us move from opinions and assumptions to clearer decisions.
Manny Aloysius | Molehill High School
REFLECTION
What I'd carry forward
What I'd do differently
I'd pressure-test the governance model with principals and teachers earlier - the planning hierarchy looked clean from the district office, but ownership at the school and classroom level took more iteration than we scoped for.
What this taught me
The recurring theme across every stakeholder group was the same: teams weren't lacking effort, they were lacking a shared system. Once planning, execution, and reporting lived in one place with clear ownership, alignment followed.